
A fishbone diagram is a tool designed to help organizations clearly see the "root cause of a problem" and lead to sustainable solutions, not just addressing the symptoms.

What is a Fishbone Diagram?
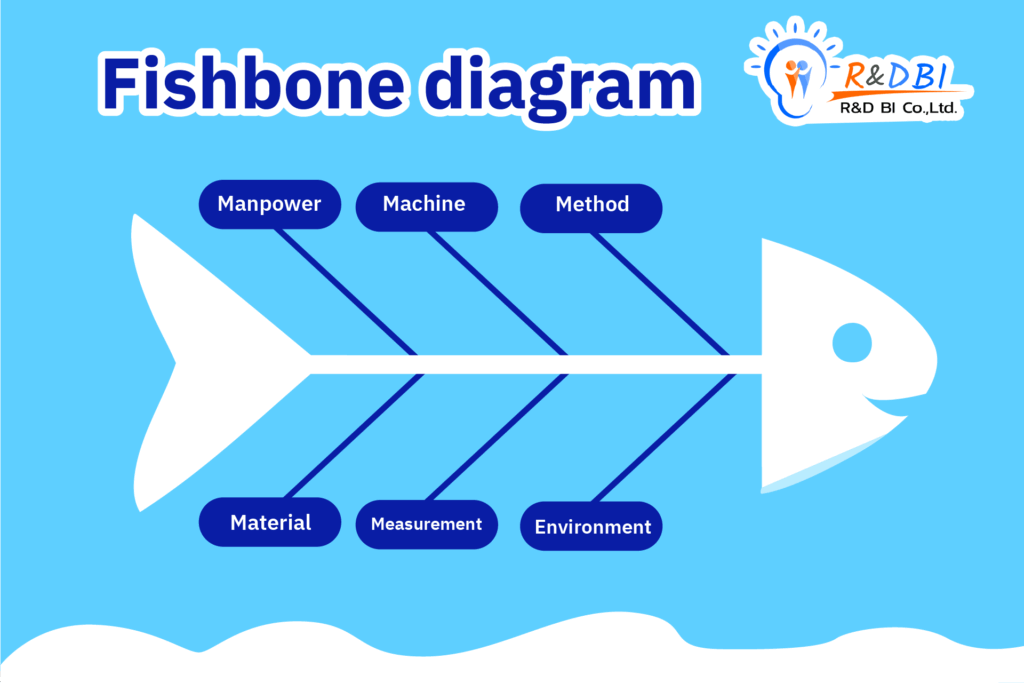
A fishbone diagram is a tool that helps identify and group "causes of a problem" to link them to "effects." It resembles a fishbone, with each bone representing a different group of causes. Using this diagram allows for systematic and comprehensive problem analysis
It is often used in conjunction with the 5 Whys technique to effectively uncover the root cause of the problem
History and Origins
The Fishbone Diagram was developed by Dr. Kaoru Ishikawa, a Japanese scholar and expert in quality control. He first applied the concept to improve production efficiency at the Kawasaki shipyard between 1960 and 1968. Although the concept has its roots in the 1920s, Dr. Ishikawa popularized it worldwide, making it one of the Seven Quality Control Tools (7 QC Tools) used in modern organizational management.
How to use a Fishbone Diagram
1. Define the main problem (Effect)
Start by clearly identifying the problem you want to analyze, such as "declining sales" or "customer dissatisfaction," and write it at the "head of the fish" (the top of the chart)
2. Draw the skeleton structure
Draw a straight line from the head of the fish to the tail. This line is the main guideline that will show the groups of causes to be identified
3. Assign categories to the causes (Cause Categories)
Group the causes into categories based on the business context, such as:
For industrial use (6M Model)
- Manpower (people): Skills, knowledge, and behavior of personnel.
- Machine : Equipment, tools, or technology.
- Method : Steps, processes, work procedures.
- Material : The raw materials or information used.
- Measurement : A method of checking quality or evaluating results.
- Mother Nature / Environment : External factors that cannot be directly controlled, such as weather, laws, and network systems.
For service businesses (4S Model)
- Surroundings: The environment of the place.
- Suppliers: Service providers or suppliers.
- Systems: The systems or technologies used.
- Skills: The abilities and expertise of the employees.
4. Identify sub-causes
Break down the details within each category. For example, in the "People" group, you might find that "Employees did not receive prior training before starting work." You can then use the 5 Whys to ask progressively deeper questions to uncover the root cause.
5. Analyze and prioritize
Assess which causes have the greatest impact on the main problem and consider possible solutions, prioritizing them in order to plan for effective implementation
6. Develop solutions
The results of the analysis should be used to develop targeted solutions, and the results of the improvements should be continuously monitored to prevent the problem from recurring
Case study example: Sales dashboard discrepancy
Problem: The monthly sales figures in the dashboard do not match the reports from the accounting department.
Analyzed using 6M:
1. Manpower:
- The data analyst misunderstood the requirements
- There was no internal review before the dashboard was released
2. Machine:
- Power BI is using an old filter
- The POS system in some branches has unstable connectivity
3. Method:
- Missing QA/UAT procedure
- ETL does not include data from all sources
4. Material:
- Use the staging data table instead of the production table
- An incorrectly formatted date field is causing data to be missing
5. Measurement:
- No validation rule has been set up to check the total amount
- There are no KPIs to measure the accuracy of the data
6. Environment:
- The database system is syncing slowly
- Some branches of the POS network are experiencing problems
Proposed solutions:
Establish SOPs for data verification, conduct QA/UAT before every release, and increase cross-team meetings to ensure a shared understanding of requirements
Advantages of using a Fishbone Diagram
- Help to systematically gather opinions from various parties
- The connection between the cause and the problem is clearly visible
- Suitable for both practical problem solving and strategic planning
- It can be used in all departments, not just the production line
summarize
A fishbone diagram is a powerful tool for analyzing the root causes of systemic problems. It provides both an overview and detailed analysis simultaneously, making it suitable for use in various sectors including industry, service, and general organizational management.
Implementing a fishbone diagram in conjunction with cross-departmental collaboration and continuously using the data to improve processes will help reduce the likelihood of recurring problems and foster sustainable growth for the organization
📚 Read more articles at:
👉 https://demo.rdbi.co.th/blog/
📞 For further inquiries:
Facebook: https://www.facebook.com/RandDBI/
Line Official: @rdbi
Phone: 02-681-9700
Email: sales@rdbi.co.th