
Training Dates: November 14-15, 21-22, and 28-29, 2019 (6 days total).
Data cleansing prepares data for model building, classifying data, handling missing values, and identifying outliers. For more details, please read on.
Data Engineer Job: Data Cleansing
Data is divided into two types:
– Categorical data grouping is divided into three subgroups: Ordinal (grouping numerical data in an orderly manner), Binary (grouping by alphabet), and Nominal (grouping by noun characteristics)
– Continuous numerical data
Data manipulation to enable analysis includes transforming nominal data by counting, converting sequential numerical data to ordinal data, dividing data into equal intervals, or counting the frequency of each interval
Dealing with Missing Values
Handling the target data for model building, for example, if we want to predict customer churn, we need data on customers who have churned and those who have not, divided into two groups. The amount of data used should be in a roughly equal proportion; we shouldn't use all customer data for the prediction
There are three ways to handle information that customers do not wish to disclose, such as income or salary, marital status, and credit bureau records:
– Replace missing values with similar values. For credit bureau reports, use the mean or median to replace missing values. For status reports, use the mode to replace missing values, and so on.
– Delete.
– Keep the information if it's important, but categorize it. For example, income; the absence of data means there's no income, perhaps the person is unemployed, etc.
Finding outliers and displaying their findings to highlight abnormalities in the data
Preparing data for analysis requires identifying anomalies and calculating them using the standard deviation (SD) or initial radius (IQR), as shown in the image
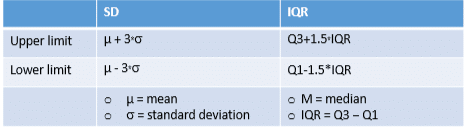
For detecting anomalies, Professor Phaisan recommends using IQR, which is more reliable than the standard deviation (SD)
Standardization is the process of scaling data to a range we want, such as [0, 1] or [-1, +1]. There are three methods:
1) Min/Max standardization as shown in Figure 2,
2) Z-Score as shown in Figure 3,
and 3) Decimal scaling as shown in Figure 4.

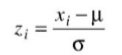

Scaling the data speeds up model building and ensures that each variable has equal importance
Lab: Handling missing data and finding anomalies using Python and Spark
For general data analysis, Weka or Python are recommended. For large datasets, Spark should be used, but it carries higher costs for personnel development and data storage
Compiled by Nuchanat Rongrong,
lecturer Dr. Phaisan Phadungwiang,
R&D BI Co., Ltd.
A collection of articles on Data Science Essential.
For more information, please contact us at https://demo.rdbi.co.th/contact/,
via our
Line official account: @rdbi,
or email sales@rdbi.co.th.