
Automated data analysis with dashboards – no need to spend money…
💡Using a dashboard to analyze sales, which is an in-depth analysis for decision-making and action, requires more detailed data and comparisons with targets or previous periods, such as:
- Daily, weekly, monthly, quarterly, and yearly sales figures
- What are the best-selling periods and products? (By branch and area)
- Which product is the most profitable? Which one is the least profitable?
- New and existing customers at different times
- Sales, profit, profit percentage, and costs for each sales channel
- What products did customers buy, and from which channels?
💡 Automated dashboard data analysis eliminates the need for manual report generation. Executives can analyze data instantly, see reports, and make informed decisions. Identify strengths and weaknesses within the organization and develop strategies immediately. For example, determine which products or promotions to offer that resonate with customers across different channels, and decide which products to expand sales to specific channels. Analyzing customer purchasing behavior across channels allows for sales forecasting and the determination of optimal order quantities. Detailed customer analysis enables more effective targeting
📌The key to success lies in understanding your customers, collecting data, processing it, creating reports, and analyzing it. This enables quick decision-making, creating business opportunities, and gaining a competitive advantage
Therefore, R&D BI Co., Ltd. is committed to developing products called
✨“Intelligent Sales Reporting System” and “Intelligent Inventory Reporting System”✨
to help solve problems for executives and business owners, enabling them to manage sales and inventory more easily, thereby increasing revenue, reducing costs, improving efficiency, and minimizing potential risks.
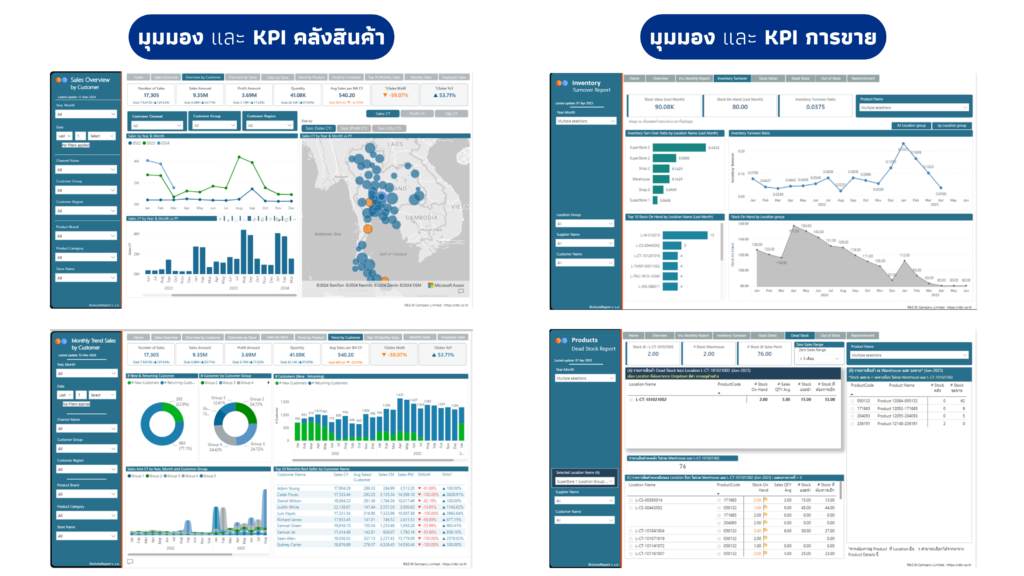
✅ Intelligent Sales Reporting System.
Functions as follows:
1. Analyzes overall sales, profit/loss, top/bottom sales, and average sales per branch.
2. Analyzes product/brand growth trends, identifying problematic product groups and
promising new
. 3. Analyzes customer behavior, including customer groups (new and existing), sales per bill, and average sales per bill.
4. Analyzes sales behavior, identifying unsold products and declining sales.
5. Analyzes the sales team, identifying which products are selling well and whether sales targets are being met.
✅ Intelligent Warehouse Reporting System
for efficient warehouse management, maximizing profits and facilitating efficient product movement between warehouses.
The system works as follows:
1. Analyzes the overall inventory, planning and managing stock effectively.
2. Checks inventory status, identifying normal and old stock.
3. Analyzes sales cycles.
4. Analyzes dead stock and out-of-stock issues.
5. Searches for and manages products, and facilitates product movement between warehouses.
✨ Drive business success with data-driven decision-making – Discover hidden insights within your data ✨
Sales and Inventory Intelligence: https://demo.rdbi.co.th/power-bi-report-template/
💡Other articles about Business Analytics: https://demo.rdbi.co.th/category/business-analytics/
For more information, please visit our page http://bit.ly/rdbipage,
Line OA: @rdbi,
Tel: 02-681-9700,
or email sales@rdbi.co.th 🌟